
Lithium distribution in partially delithiated LiFePO4
Understanding the microscopic mechanism of the de/lithiation processes during electrical cycling is crucial for improving the design of battery materials. A major challenge is the experimental detection of the lithium distribution in partially charged/discharged batteries at the nanoscale because of the weak interaction between Li atoms and fast electrons. In our recent work in collaboration with Prof. Poul Norby from Danish Technical University, we applied a STEM diffraction technique (automated crystal orientation mapping (ACOM)) to map the lithiation distribution in a half discharged lithium iron phosphate (LiFePO4/FePO4, LFP/FP) battery. We found that the majority of the nanoparticles are either completely LFP or FP. However, in addition, quite a number of (single crystalline) particles contain both LFP and FP phases with a planar interface (Figure 1.1). According to the crystallographic information provided by ACOM (Figure 1.2), we found that the LFP/FP interface is preferentially orientated normal to the [101] crystalline direction but not the widely speculated [100] or [010] axes. An average 1.5⁰ misorientation between the LFP and FP domains was detected. This implies that in addition to dislocations, lattice tilting plays a role to release the lattice mismatch between LFP and FP. This experimentally confirms the theoretical predictions based on the interfacial strain energy.

Figure 1.1: (a) ACOM-STEM Phase map of LFP (green) and FP (red) based on the crystallographic difference between both systems. (b) Phase map obtained by EFTEM-SI at the Fe-L3,2 edge (Fe valance state map) (LiFePO4: green, FePO4: red). (c) ACOM-TEM crystal orientation map. The inverse pole figure color coding is given as inset. (d) Bright-field image of the same area as c. The white boxes in a,b and c and the red box in d indicate same particle for visual guidance.

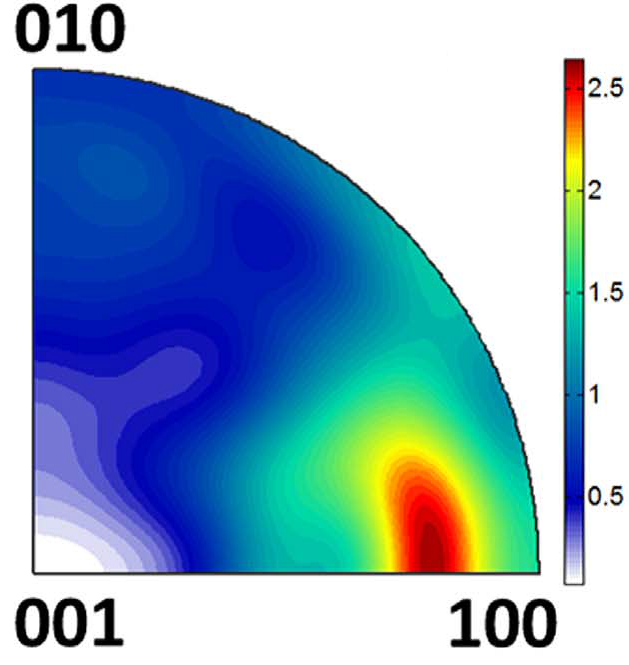
Figure 1.2: (a) ACOM phase and orientation maps of single crystalline particles with an FP/LFP interface and (b) the corresponding statistical analysis of the orientation distribution of the interface shown as orientation density in the inverse pole figure.
Spectroscopic techniques (energy filtered TEM) were applied to analyze the same sample area. The lithium distribution was analyzed 1) mapping the iron oxidation state using the Fe-L3,2 edge, 2) using the Li-K/Fe-M edges, 3) looking at the dielectric function by Kramers-Kronig analysis and 4) based on the plasmon center position. From a methodology point of view, this enabled a direct test of the consistency of the crystallography (ACOM) and oxidation/electronic states (EFTEM/EELS). The maps obtained by all methods showed excellent agreement with each other. A comprehensive comparison of all methods is done in terms of reliability, information content, dose level, acquisition time and signal quality (Table 1). The latter three are relevant for the design of in situ experiments with beam sensitive Li-ion battery materials.
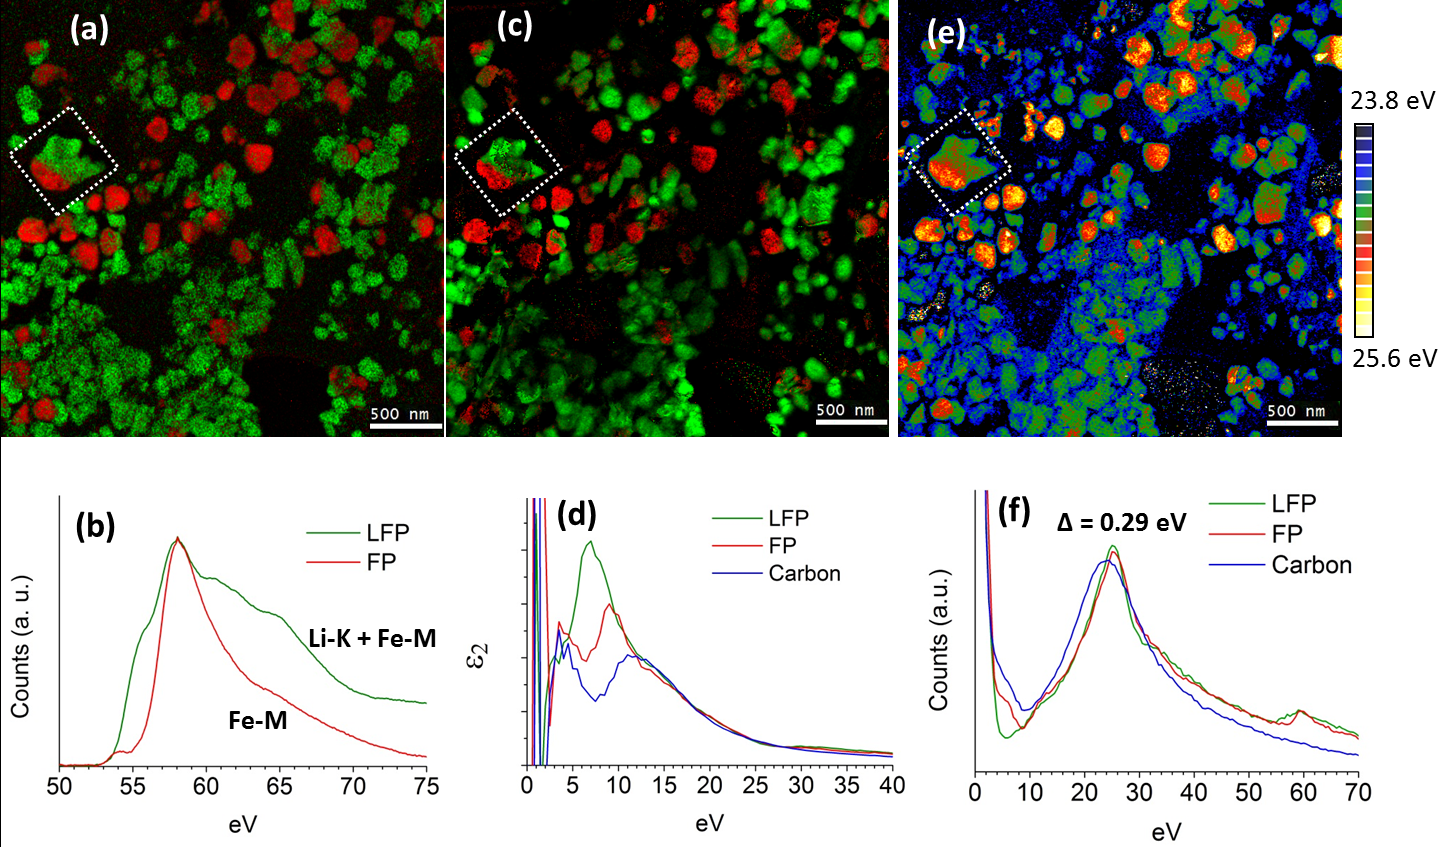
Figure 1.3: EFTEM phase maps (a) from Li-K & Fe-M signals in (b), (c) according to the dielectric functions shown in (d) computed by Kramers-Kronig equation from the signal caused by interband transitions. (e) Volume plasma center map. (f) low-loss spectra of LFP, FP and carbon substance.
| Methods | Energy rnage [eV] | Dose [105 e nm-2] | Aquisition Time [min] | Information |
| Fe-L3 | 696 - 720 | 16 | 50 | Fe valence state |
| Li-K / Fe-M | 50 - 66 | 4.2 | 13 | Fe valence and Li environment |
| Kramers-Kronig | -4 - 30 | 1.6 | 5 | Dielectricity & optical properties |
| Plasma Center | 23 - 28 | 0.31 | < 1 | Charge density |
| ACOM | 3.7 | 45 | Crystallography and orientations relating to the phase interface |
Table 1: Comparison of LFP/FP phase mapping methods in terms of acquisition dose, acquisition time and information contents (for a 500x500 pixel map with 6 nm pixel size)
Details have been published at
- Comprehensive analysis of TEM methods for LiFePO4/FePO4 phase mapping: spectroscopic techniques (EFTEM, STEM-EELS) and STEM diffraction techniques (ACOM-TEM), X. Mu, A. Kobler, D. Wang, V.S.K. Chakravadhanula, S. Schlabach, D.V. Szabó, P. Norby, C. Kübel, Ultramicroscopy, 2016, 170, 10-18; DOI: 10.1016/j.ultramic.2016.07.009.
![]()
This project has been third-party funded by the European Union through the 7th framework program for research, technological development and demonstration under grant agreement No. 608575.